Analytics365

Every Department. Every KPI. One Clearer View of Your Business.

Analytics365 gives each department a dedicated operational console while bringing performance together in an Executive Console. Track progress against targets, monitor forecasts, identify bottlenecks, and understand where action is needed, all using information already connected across Core365.

Book a Demo
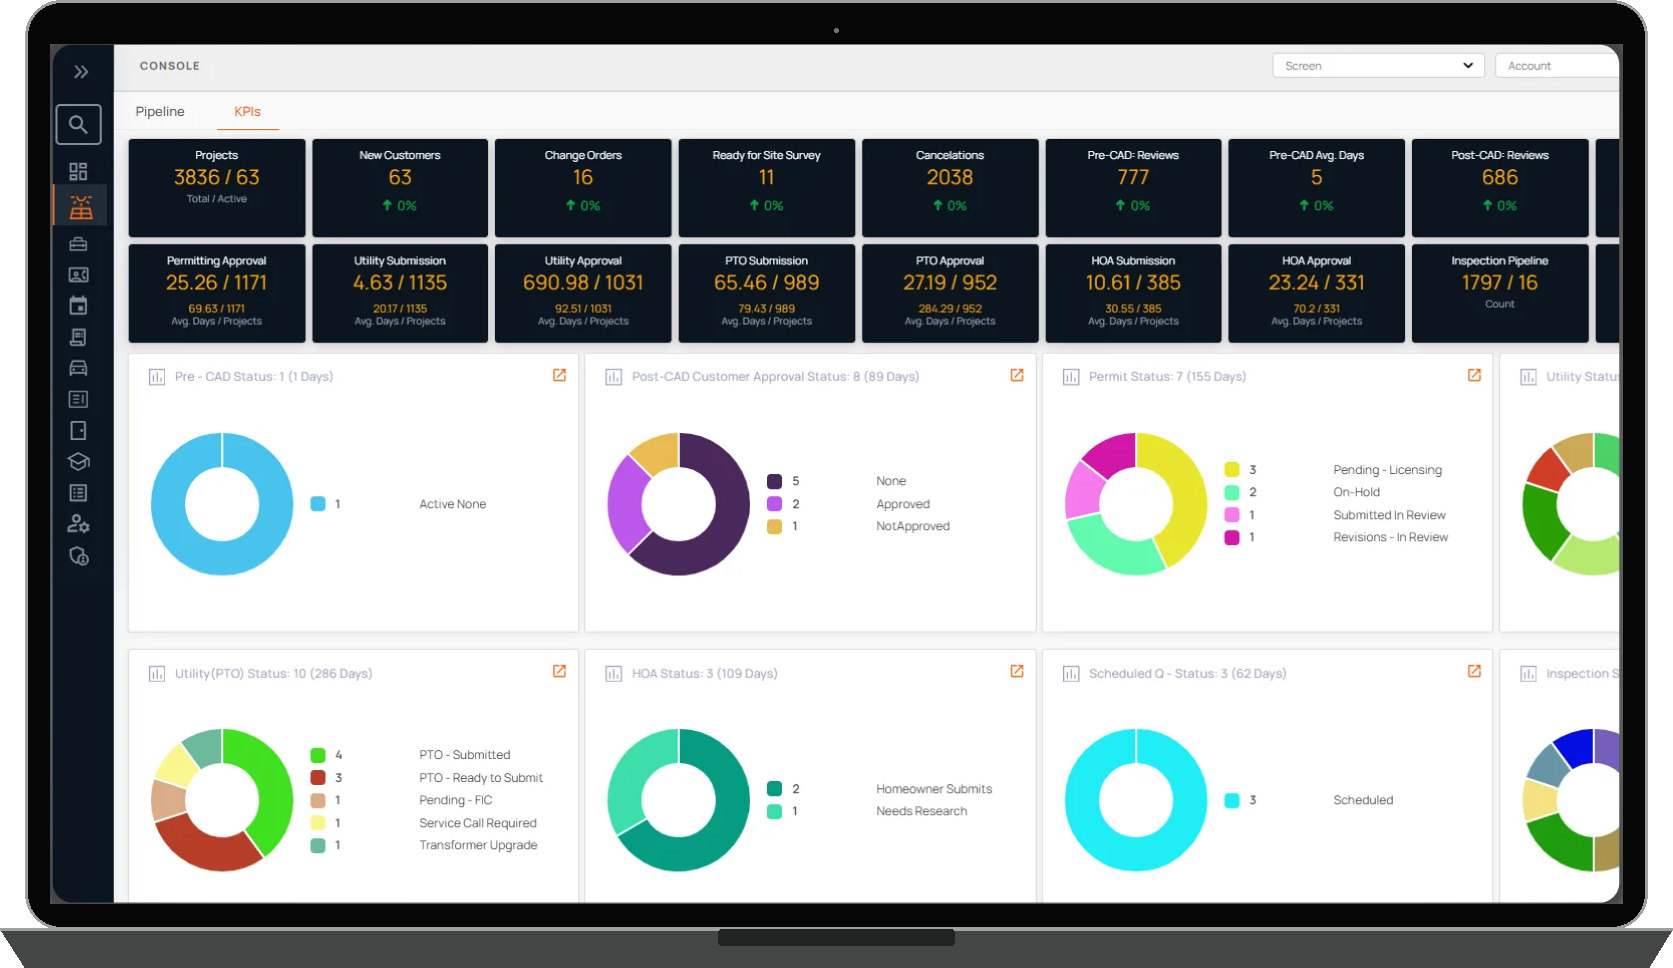
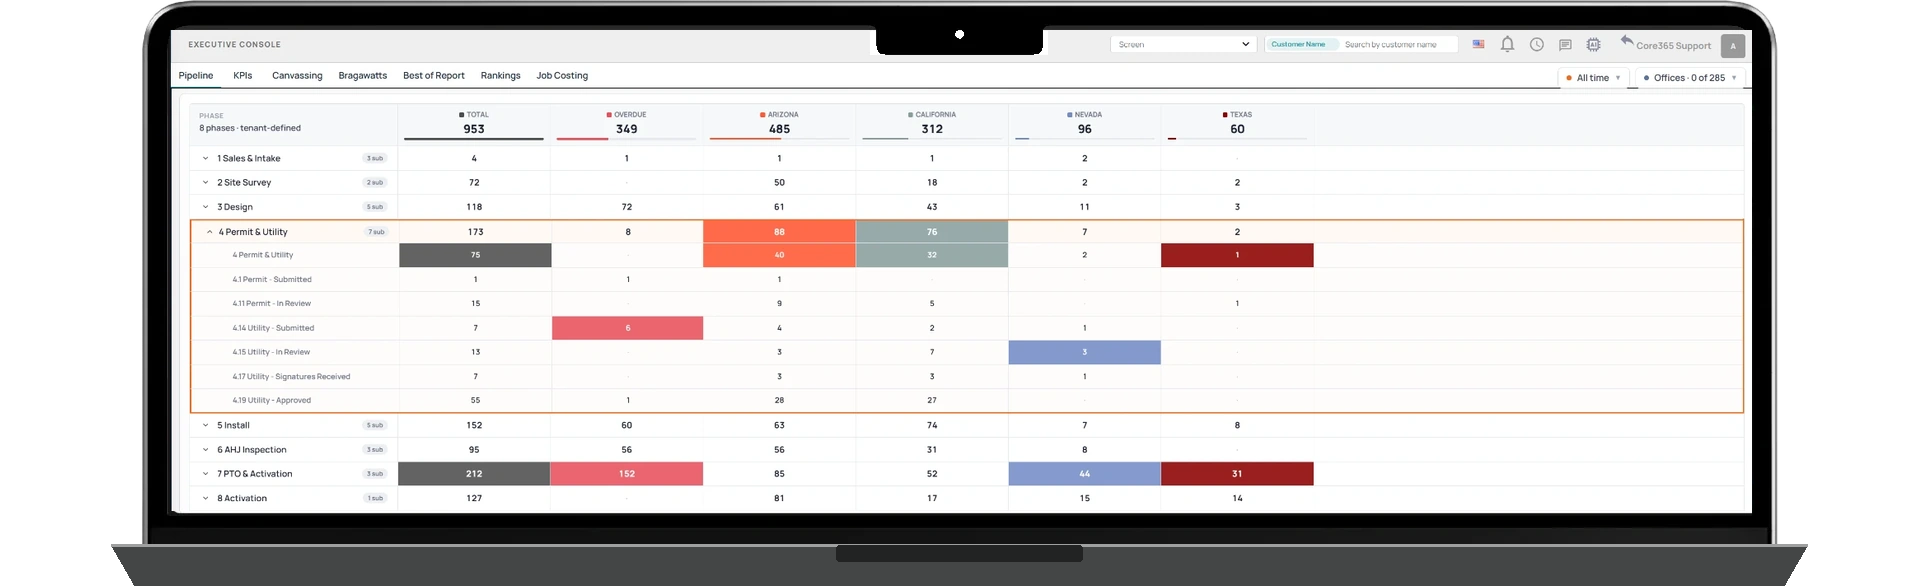
Analytics365 Executive Console pipeline dashboard

Executive Intelligence, Connected to Your Operations

The Executive Console brings financial, sales, productivity, and operational KPIs into one place.

Leadership can filter results by reporting period, office, state, team, and sales representative, compare performance against established targets, review forecasts, and investigate trends.

Rather than relying on disconnected spreadsheets and department reports, executives can see how performance across the business connects to operational execution.

Financial and Productivity KPIs

Renewable energy examples include net revenue, completed deals, completed installations, gross installed kilowatts, win rate, net price per watt, project cancellations, total projects, leads created, proposals submitted, inspections completed, activations completed, PTO completed, projects in pipeline, stage cycle times, and stage-to-stage handoff durations.

Executive Console Views

Confirmed renewable energy tabs include Pipeline, KPIs, Canvassing, Bragawatts, Best of Report, Rankings, and Job Costing. Available tabs and KPIs vary by tenant and industry.

DEPARTMENT-SPECIFIC CONSOLES

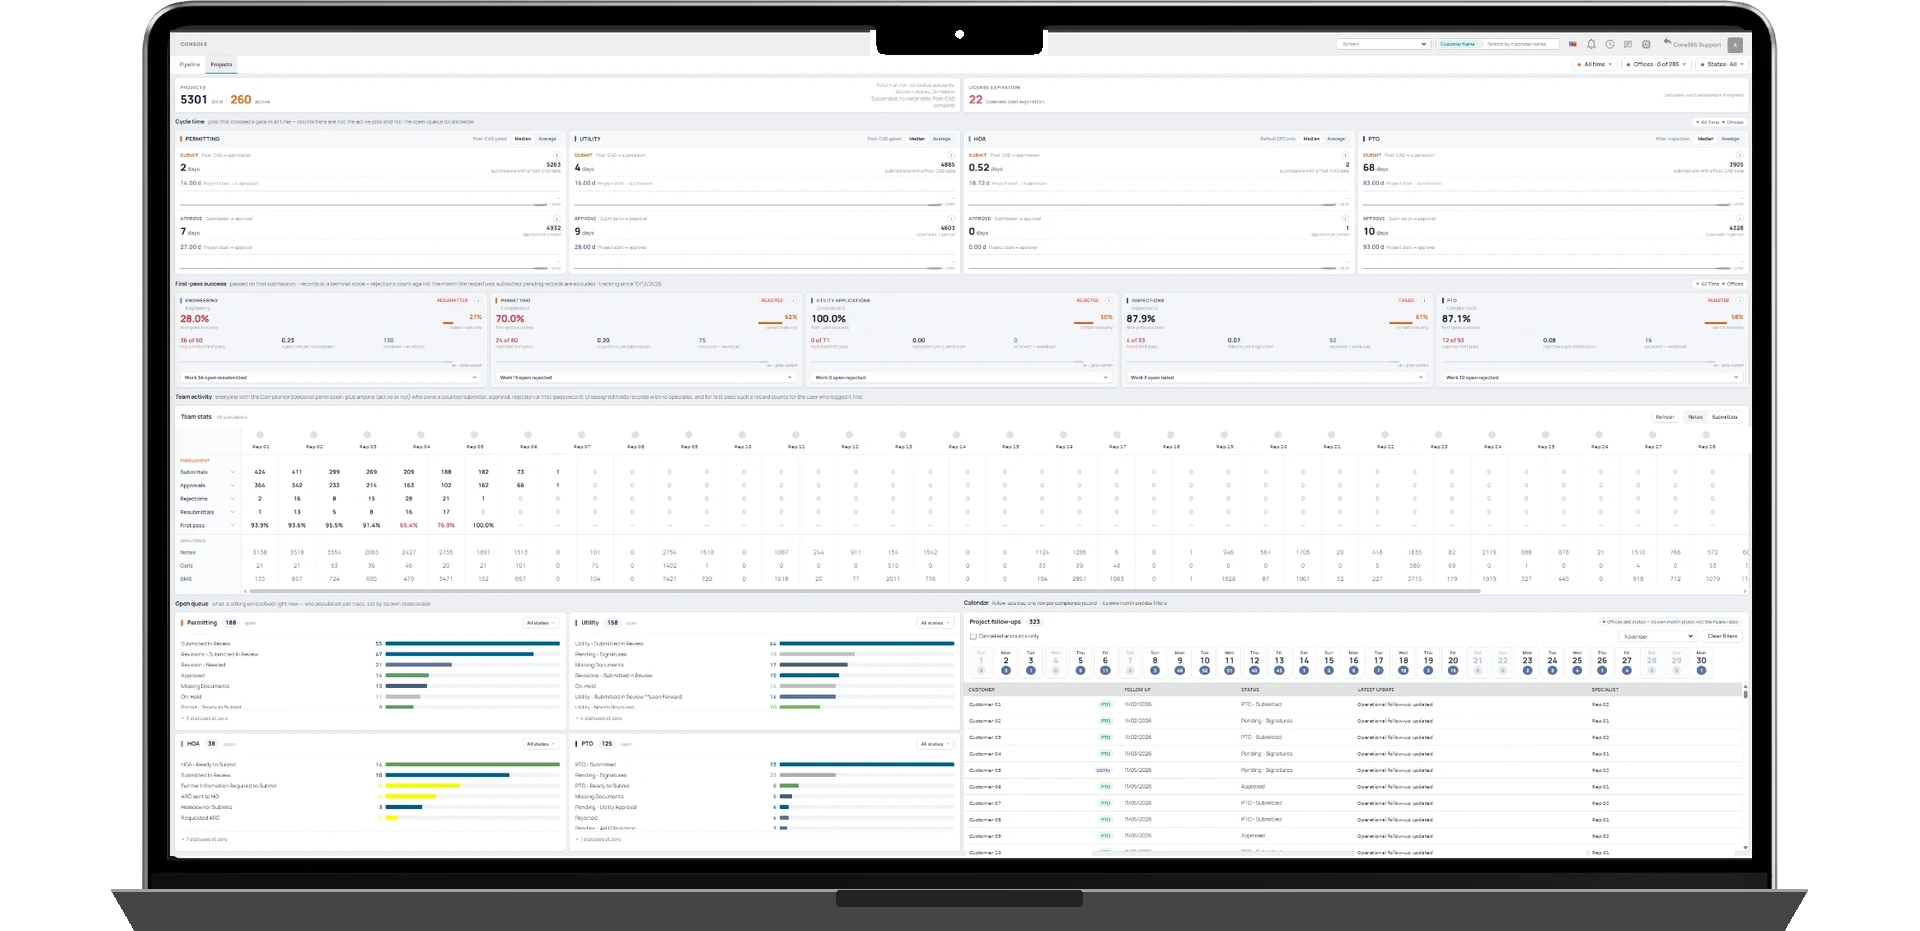
Dedicated operational consoles give departments visibility into the KPIs relevant to their responsibilities.

CONFIGURABLE KPIs & FORECASTS

Authorized administrators can configure KPIs and thresholds, with forecasts based on targets and configurable projection formulas.

AI-ASSISTED PERFORMANCE INSIGHTS

Supported KPI views combine AI and business rules to explain performance changes and recommend actions.

Built Around How Your Departments Actually Operate

Confirmed renewable energy operational consoles include:

  • Executive Console – Renewable Energy
  • EPC Console
  • Customer Experience Console, within Intake/NTP
  • Engineering Console
  • Compliance Console
  • Project Management Console
  • Installation Console
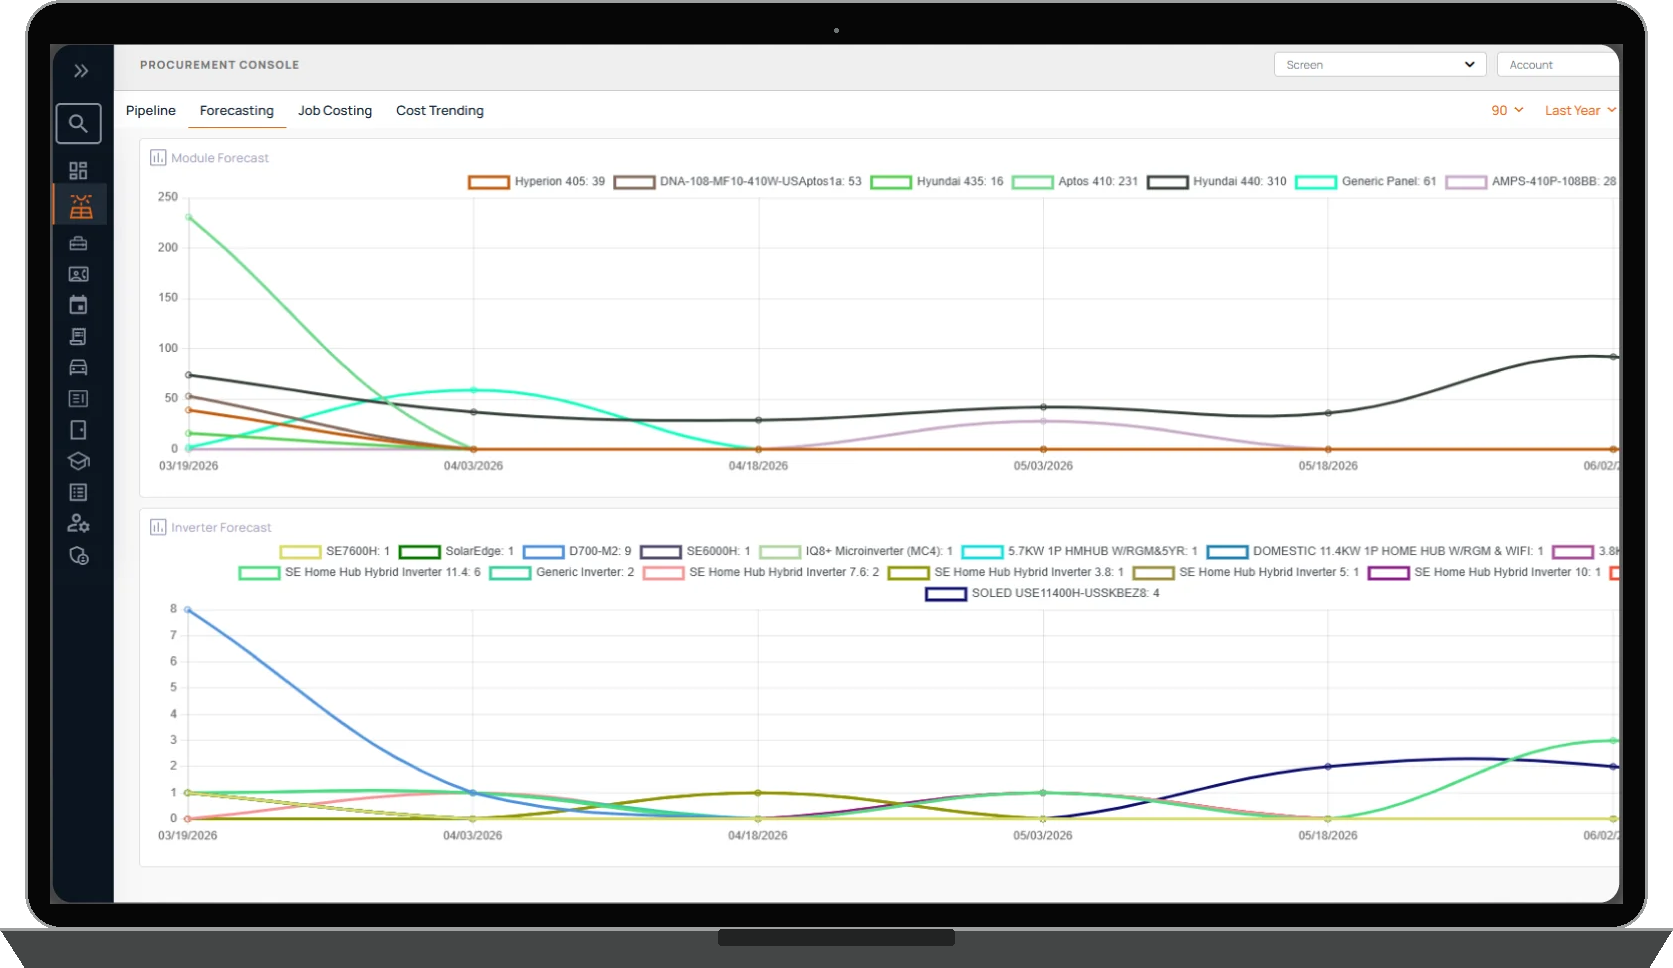
  • Procurement Console
  • Inspection Console
  • PTO / Activation Console
  • Field Service Console
  • Finance & Accounting Console
  • Funding Console

Customer Journey and Document Management are additional functional areas within the application. Core365 also has a separate Security industry area. Available consoles, KPIs, configuration, forecasts, and drilldowns vary by industry and supported view; departmental queues and settings are not separate Analytics365 consoles.

From customer intake and engineering to compliance, installation, activation, funding, and service, Core365 gives departments visibility into the performance measures relevant to their responsibilities.

Dedicated operational consoles help managers monitor workload, measure progress, identify exceptions, and understand how their departments are performing.

KPIs and Targets Built Around Your Business

Authorized tenant administrators can configure KPIs and performance thresholds to reflect their organization's operational priorities. Supported forecasts use targets and configurable projection formulas to estimate performance, helping managers understand expected results and identify gaps before the reporting period ends.

  • Administrator-configured KPIs and performance thresholds
  • Formula-based forecasts, not machine-learning predictions or guaranteed outcomes
  • Users can select which available KPIs appear in the Executive Console
KPIs and Targets Built Around Your Business

Early Access

Reports365: Custom Reporting Built Around Your Questions

Analytics365 is part of the standard Core365 operational platform: departmental consoles, executive KPIs, targets, configurable forecasts, performance trends, and supported insights. Reports365 is a separate offering for custom reports using supported Core365 data.

  • Select fields, apply filters, save report configurations, and export supported data
  • Reports365: Early Access
  • Automations365: Early Access — a separate offering for configurable workflows using supported triggers, conditions, branching, and actions

These are distinct offerings; purchasing one does not include the others. Built-in operational workflow automation is not the separately offered Automations365 product. Early Access does not imply general availability.

Explore Reports365 →

Investigate the Information Behind Performance

Selected consoles and KPIs support interactive drilldowns into underlying operational information. Managers can investigate supported views to understand performance changes and decide where to focus attention.

  • Supported operational performance views
  • Historical trends and performance comparisons
  • Drilldown availability varies by console and KPI
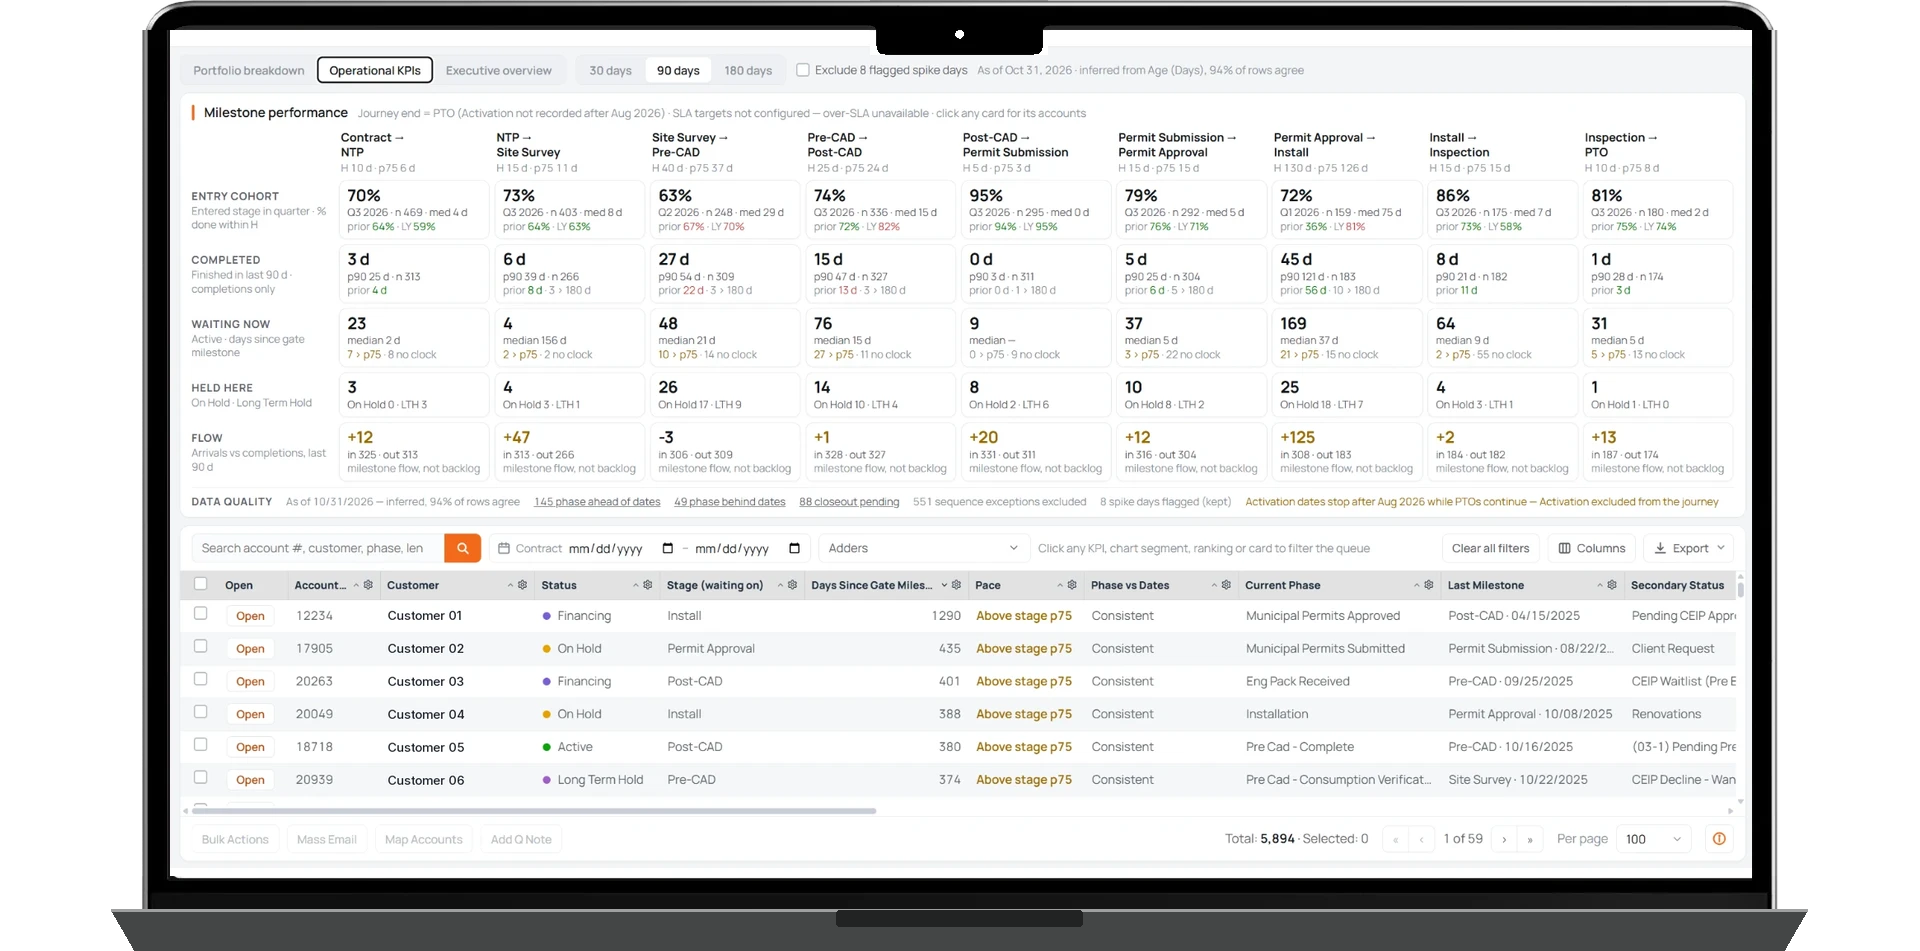
Analytics365 operational KPIs

See Where Work Moves, Slows Down, or Gets Stuck

Understand how projects progress from acquisition and intake through engineering, installation, inspection, activation, and financial operations. Monitor pipeline distribution, completion performance, milestone durations, and operational exceptions so teams can investigate delays and focus attention where it matters.

  • Pipeline by project stage, milestone completion, cycle times, and stage-to-stage handoff durations
  • Installation, inspection, PTO, and activation progress
  • Cancellation rates, funding activity, office and representative comparisons, aging, and inactivity; available measures vary by company
See Where Work Moves, Slows Down, or Gets Stuck

Performance Measurement, Connected Across Core365

Supported Executive KPI cards bring actual values, targets, forecasts, and prior-period comparisons together with performance thresholds, target status indicators, and historical trends.

  • Compare established targets with actual results and supported forecasts
  • Review historical trends and threshold status
  • Use operational context to support human judgment, not guaranteed performance outcomes
Performance Measurement, Connected Across Core365

Understand What Changed and What to Do Next

Go beyond the headline number.

Analytics365 provides detailed KPI views with historical trends, performance thresholds, explanations of changes, and recommended actions.

AI-assisted analysis works with configured business rules to help leadership understand performance and prioritize what deserves attention.

Selected consoles and KPIs also allow users to investigate the operational information behind the numbers.

  • Actual value, target, forecast, variance, and performance thresholds
  • Trailing 13-week and 12-month trends, plus the KPI definition
  • “What moved & why” and “Recommended Action” use AI together with configured business rules
  • Breakdowns by organizational unit, sales representative, and lead source

Insights are available in supported KPI views, not every KPI. Recommendations support human judgment; they do not automatically take corrective action or guarantee results.

Have We Convinced You Yet?

Let's Simplify Your Operations & Scale Smarter